
What is OLAP and OLAP Data
OLAP (OnLine Analytical Processing) technology is a part of business intelligence, along with reporting, data mining and other BI activities. It is broadly used for sales and marketing reporting, financial planning, budgeting and forecasting.
The basis of an OLAP system is OLAP cube, where four main operations can be performed with data: consolidation (roll-up), drill-down, slicing/dicing, and pivoting (rotating). Consolidation aggregates the data to accumulate it in one or more dimensions. Drill-down allows users to navigate through the details. Slicing and dicing take out a specific chunk of the OLAP cube data and view it from different points.
OLAP data consists of two core types of information: measures (numeric data) and dimensions (categories in which measures are organized).
It is worth mentioning that, unlike two-dimensional relational databases, OLAP data is multidimensional, which allows analyzing the information in different ways and from different perspectives.
What is OLAP Analysis
OLAP analysis is the analysis of multidimensional data by means of special tools. It includes complex user calculations, trend analyses, detailed data modelling etc. OLAP is mostly applied for multidimensional (not two-dimensional) data analysis, as it provides necessary powerful data manipulation and computational capabilities. The results of OLAP analysis are used in business planning and decision making.
The most common terms of OLAP data analysis you are going to see are:
- Queries. A query is a request to a database, which responds with generating required data.
- Reports represent the data retrieved by the query.
- Pivot tables visualize the data in a tabular form.
- Pivot charts visualize the data in charts and diagrams.
OLAP Analysis Tools
Nowadays, there is a big number of OLAP analysis tools on the market that allow users to retrieve their data from multiple database systems at a time and analyze it from various perspectives. They also offer a lot of data visualization options critical for business analysis specialists, and don’t require IT skills or experience.
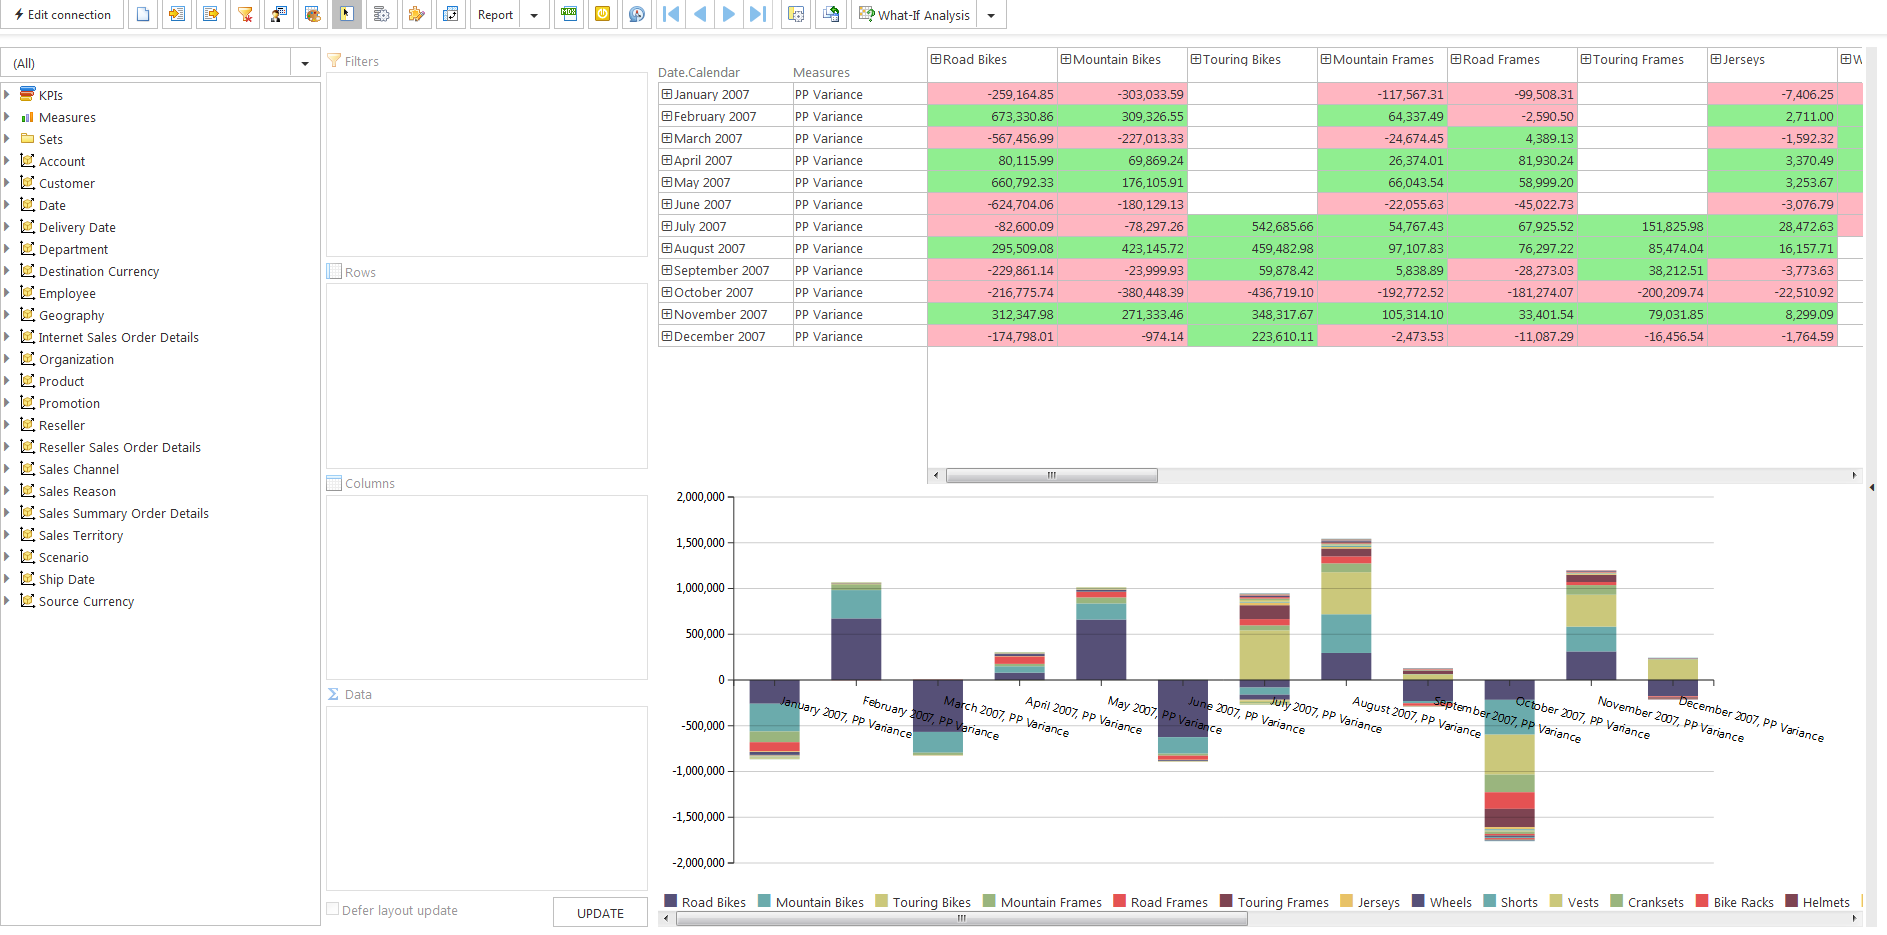
Ranet OLAP, for example, enables users to set connections to various OLAP cubes and databases. It generates interactive reports based on the available metadata, and visualizes the data in pivot tables and charts, allowing users to set up custom calculations and cell styles rules. Most OLAP tools also provide easy integration into ready applications.


